You planned for 500 tons of grade A. What will actually arrive?
Short, and you are buying on the spot market or letting a customer down. Over, and it sits, loses grade, or goes to waste.
ListenField analyses the position, revises the plan, and reports actual output against it — so you know the season is being managed to your target.
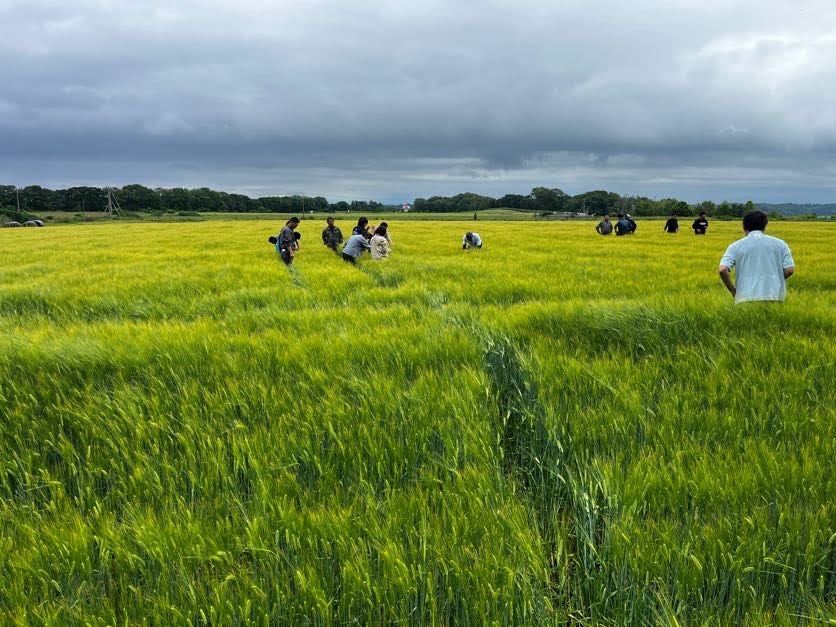
The same three problems, whatever the crop.
“We plan for 500 tons. Some weeks it is 420, some weeks 570 — and both cost us.”
Under, and we turn away orders we could have taken. Over, and it waits, drops a grade, or goes to waste. The opportunity is lost either way.
“One region fell behind, and we need an alternative plan to compensate.”
Making up the gap means knowing which other areas have room, and knowing it early enough that moving is still an option.
“We found out we were short, but we do not know why.”
Without a record for each field — what was planted, what was applied, what the weather did — the same surprise comes back next season.
We start from your business target. Then work back to the field.
Most systems start at the field. We start from the volume and the quality you need, and use that to build the planting, management and harvest plans — tracking progress and weather together, so the plan can be revised while there is still time to act.
Both are analysed together, so the forecast is accurate on volume and on quality — not just on tonnage.
Harvest week first. Then back through field management, nutrient management, land preparation and planting — across every field under contract, so the crop reaches the grade you need.
The information each role needs reaches growers, agronomists, field operators and machine contractors — and what they complete is recorded back into the system.
When a field drifts off the plan, the plan changes — not your target. The system re-cuts the schedule, tells whoever is affected, and updates the number you are planning against.
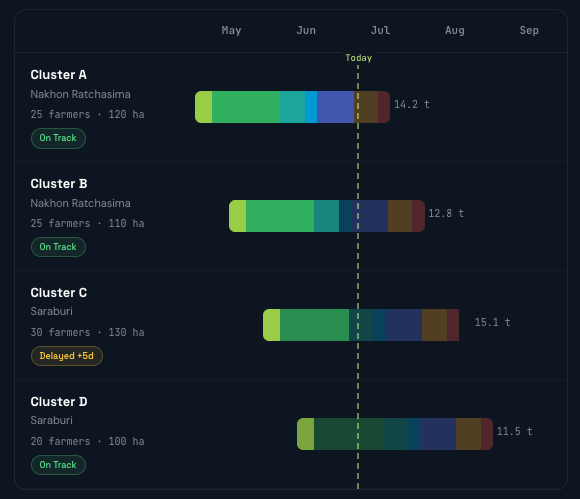
Every field tracked, from land preparation to harvest.
No dashboard to keep opening. No reports to build yourself. Every day and every week, the system checks every field, finds what is holding yield below target, analyses further to identify the cause, and sends a revised plan to everyone involved.
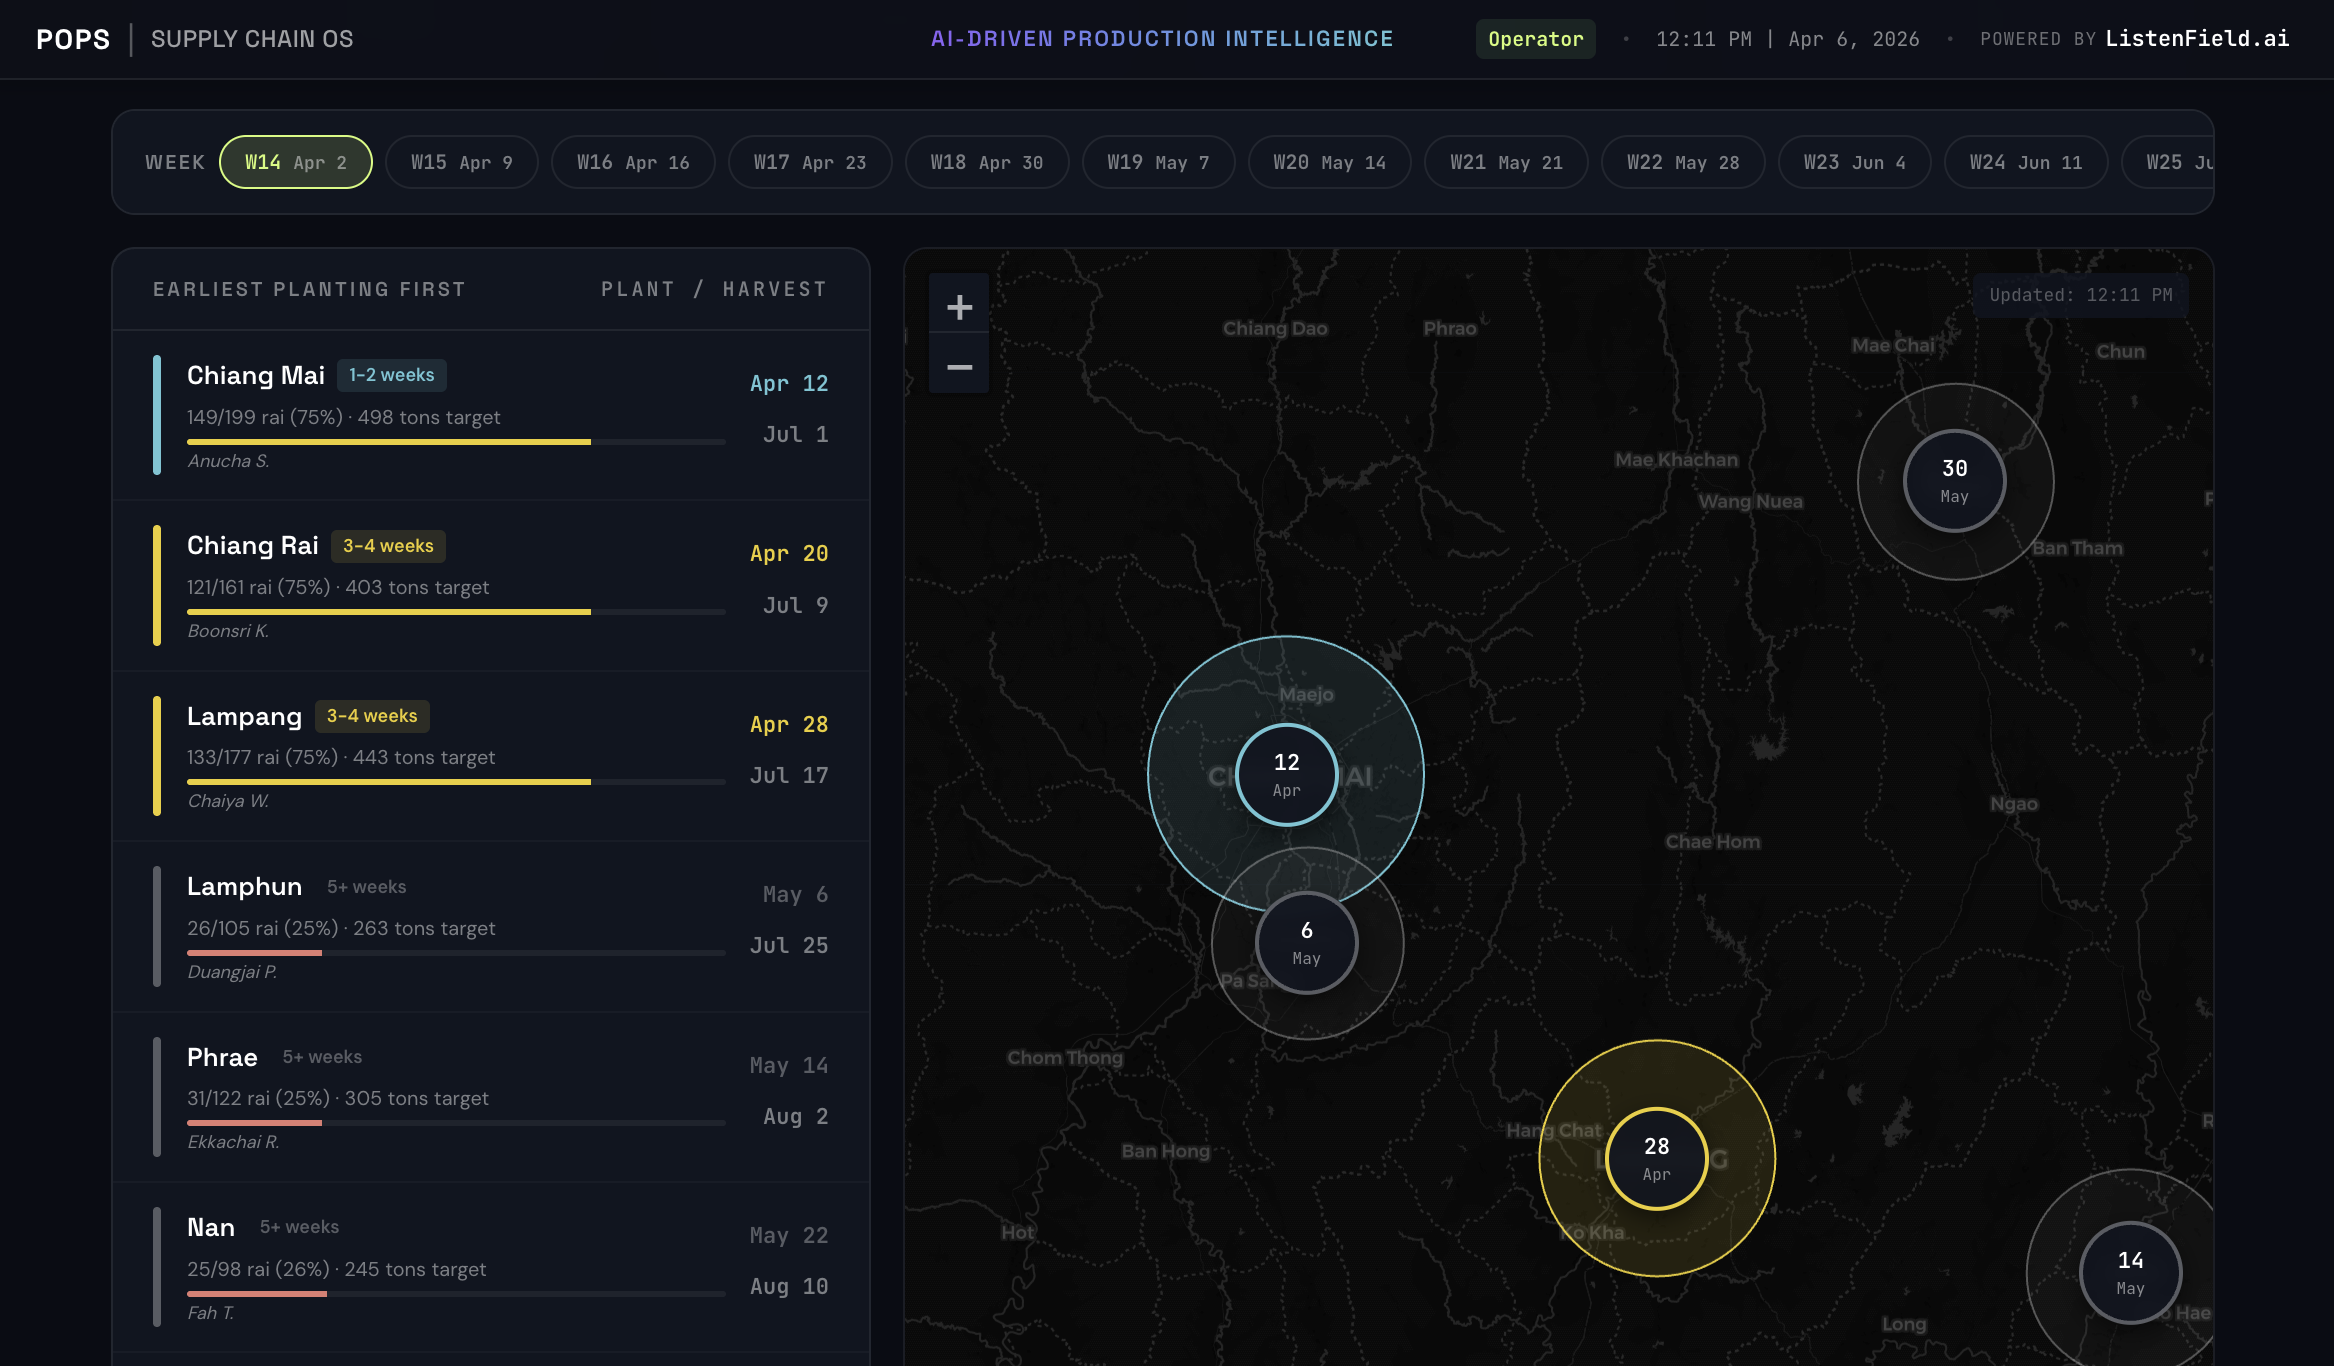
The information you receive, across the whole production process.
Accurate information for managing the full production chain, arriving on its own and continuing to arrive.
Eight years in commercial use, improved every day.
ListenField has been running inside working food and agriculture supply chains since 2017. Every dataset, every model and every figure on screen comes from published research and established science.
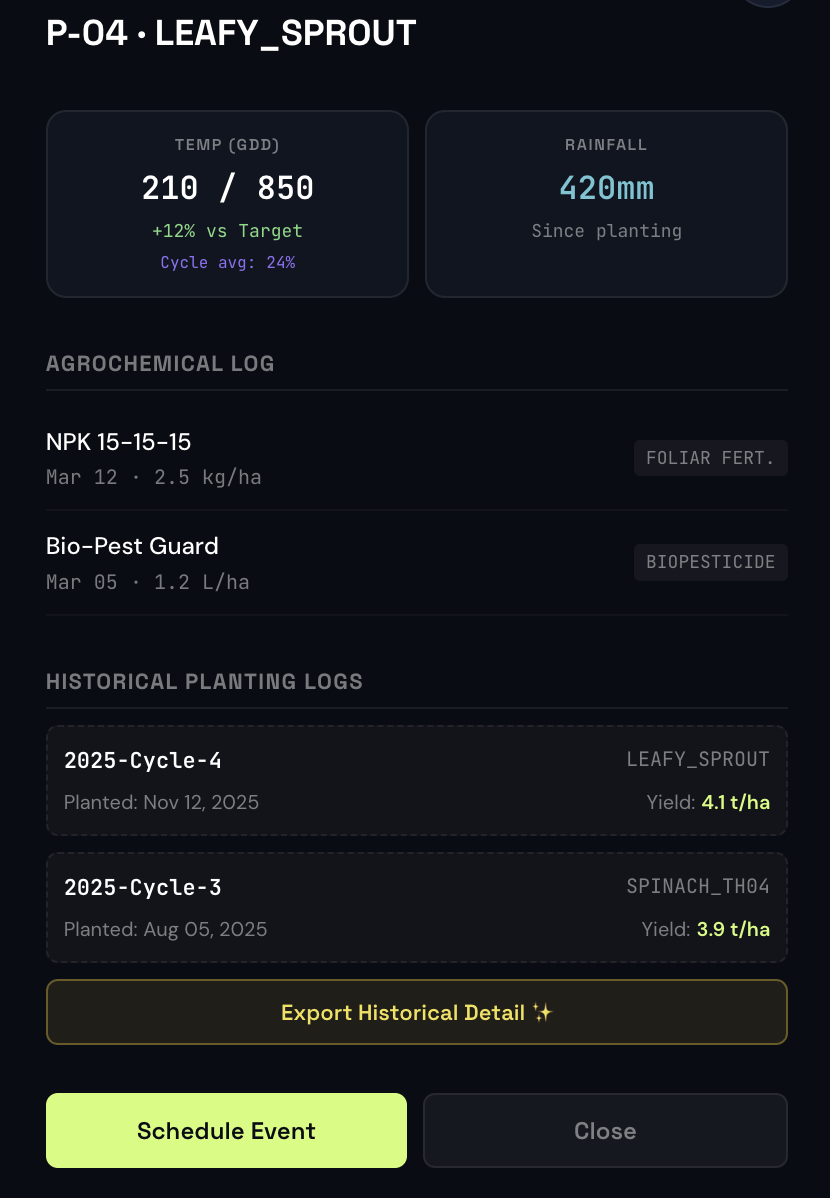
Four well-established methods, already proven in their own fields, joined into one system:
If your crop is not on this list, it is a matter of setting it up and letting it learn a season — not of inventing something new. Ask us what that looks like for yours.
Start with a trial on one target area.
We will show you what your supply looks like for the coming season — and where it is most likely to go wrong. Half an hour, your own fields, no slides.